About me
Analytical Engineer/Data Analyst with 3 years of experience in the data field, with knowledge in architecture and load processes for DataLake; SQL for developing refined tables with business rules for consumption in Azure Databricks and Snowflake; PySpark/Data Factory for data extraction via external APIs, with data ingestion into the Data Lake; Data flow management with Azure Data Factory; Dashboards development in Power BI and Tableau. Key soft skills include teamwork, fast learning, adaptability, and autonomy.
Solutions
-

Data Analytics Consulting
Modern, clean and user-friendly layouts in Figma for professional dashboards in Power BI and Tableau for strategic insights, all accompanied by comprehensive technical documentation.
-

Data Solutions Development
Knowledge in Data Lake architecture for data extractions via APIs, ingestion, and flow management. SQL modeling, refining data tables with business logic, and integrating into cloud environments such as Azure Data Factory and Snowflake.
Portfolio
-
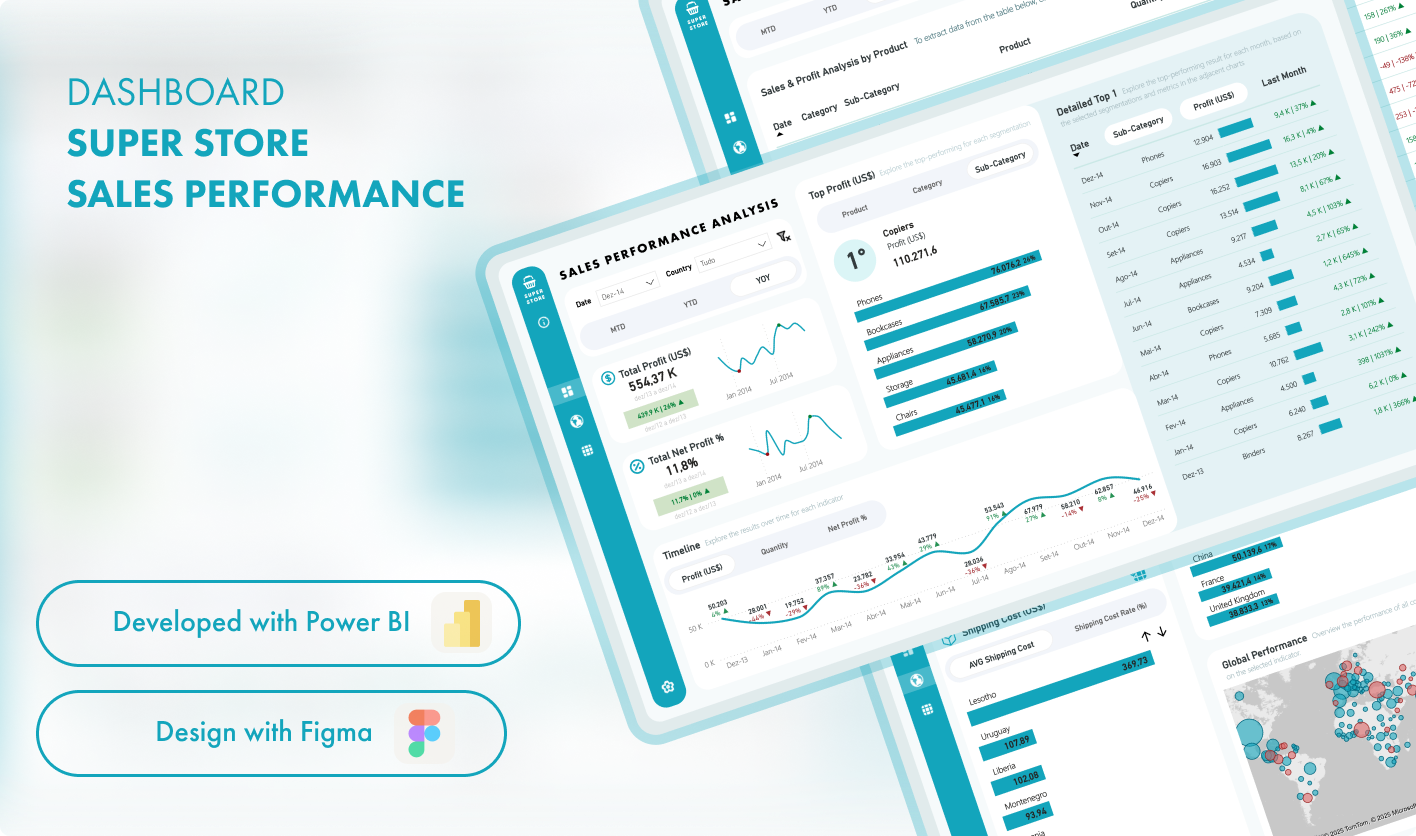
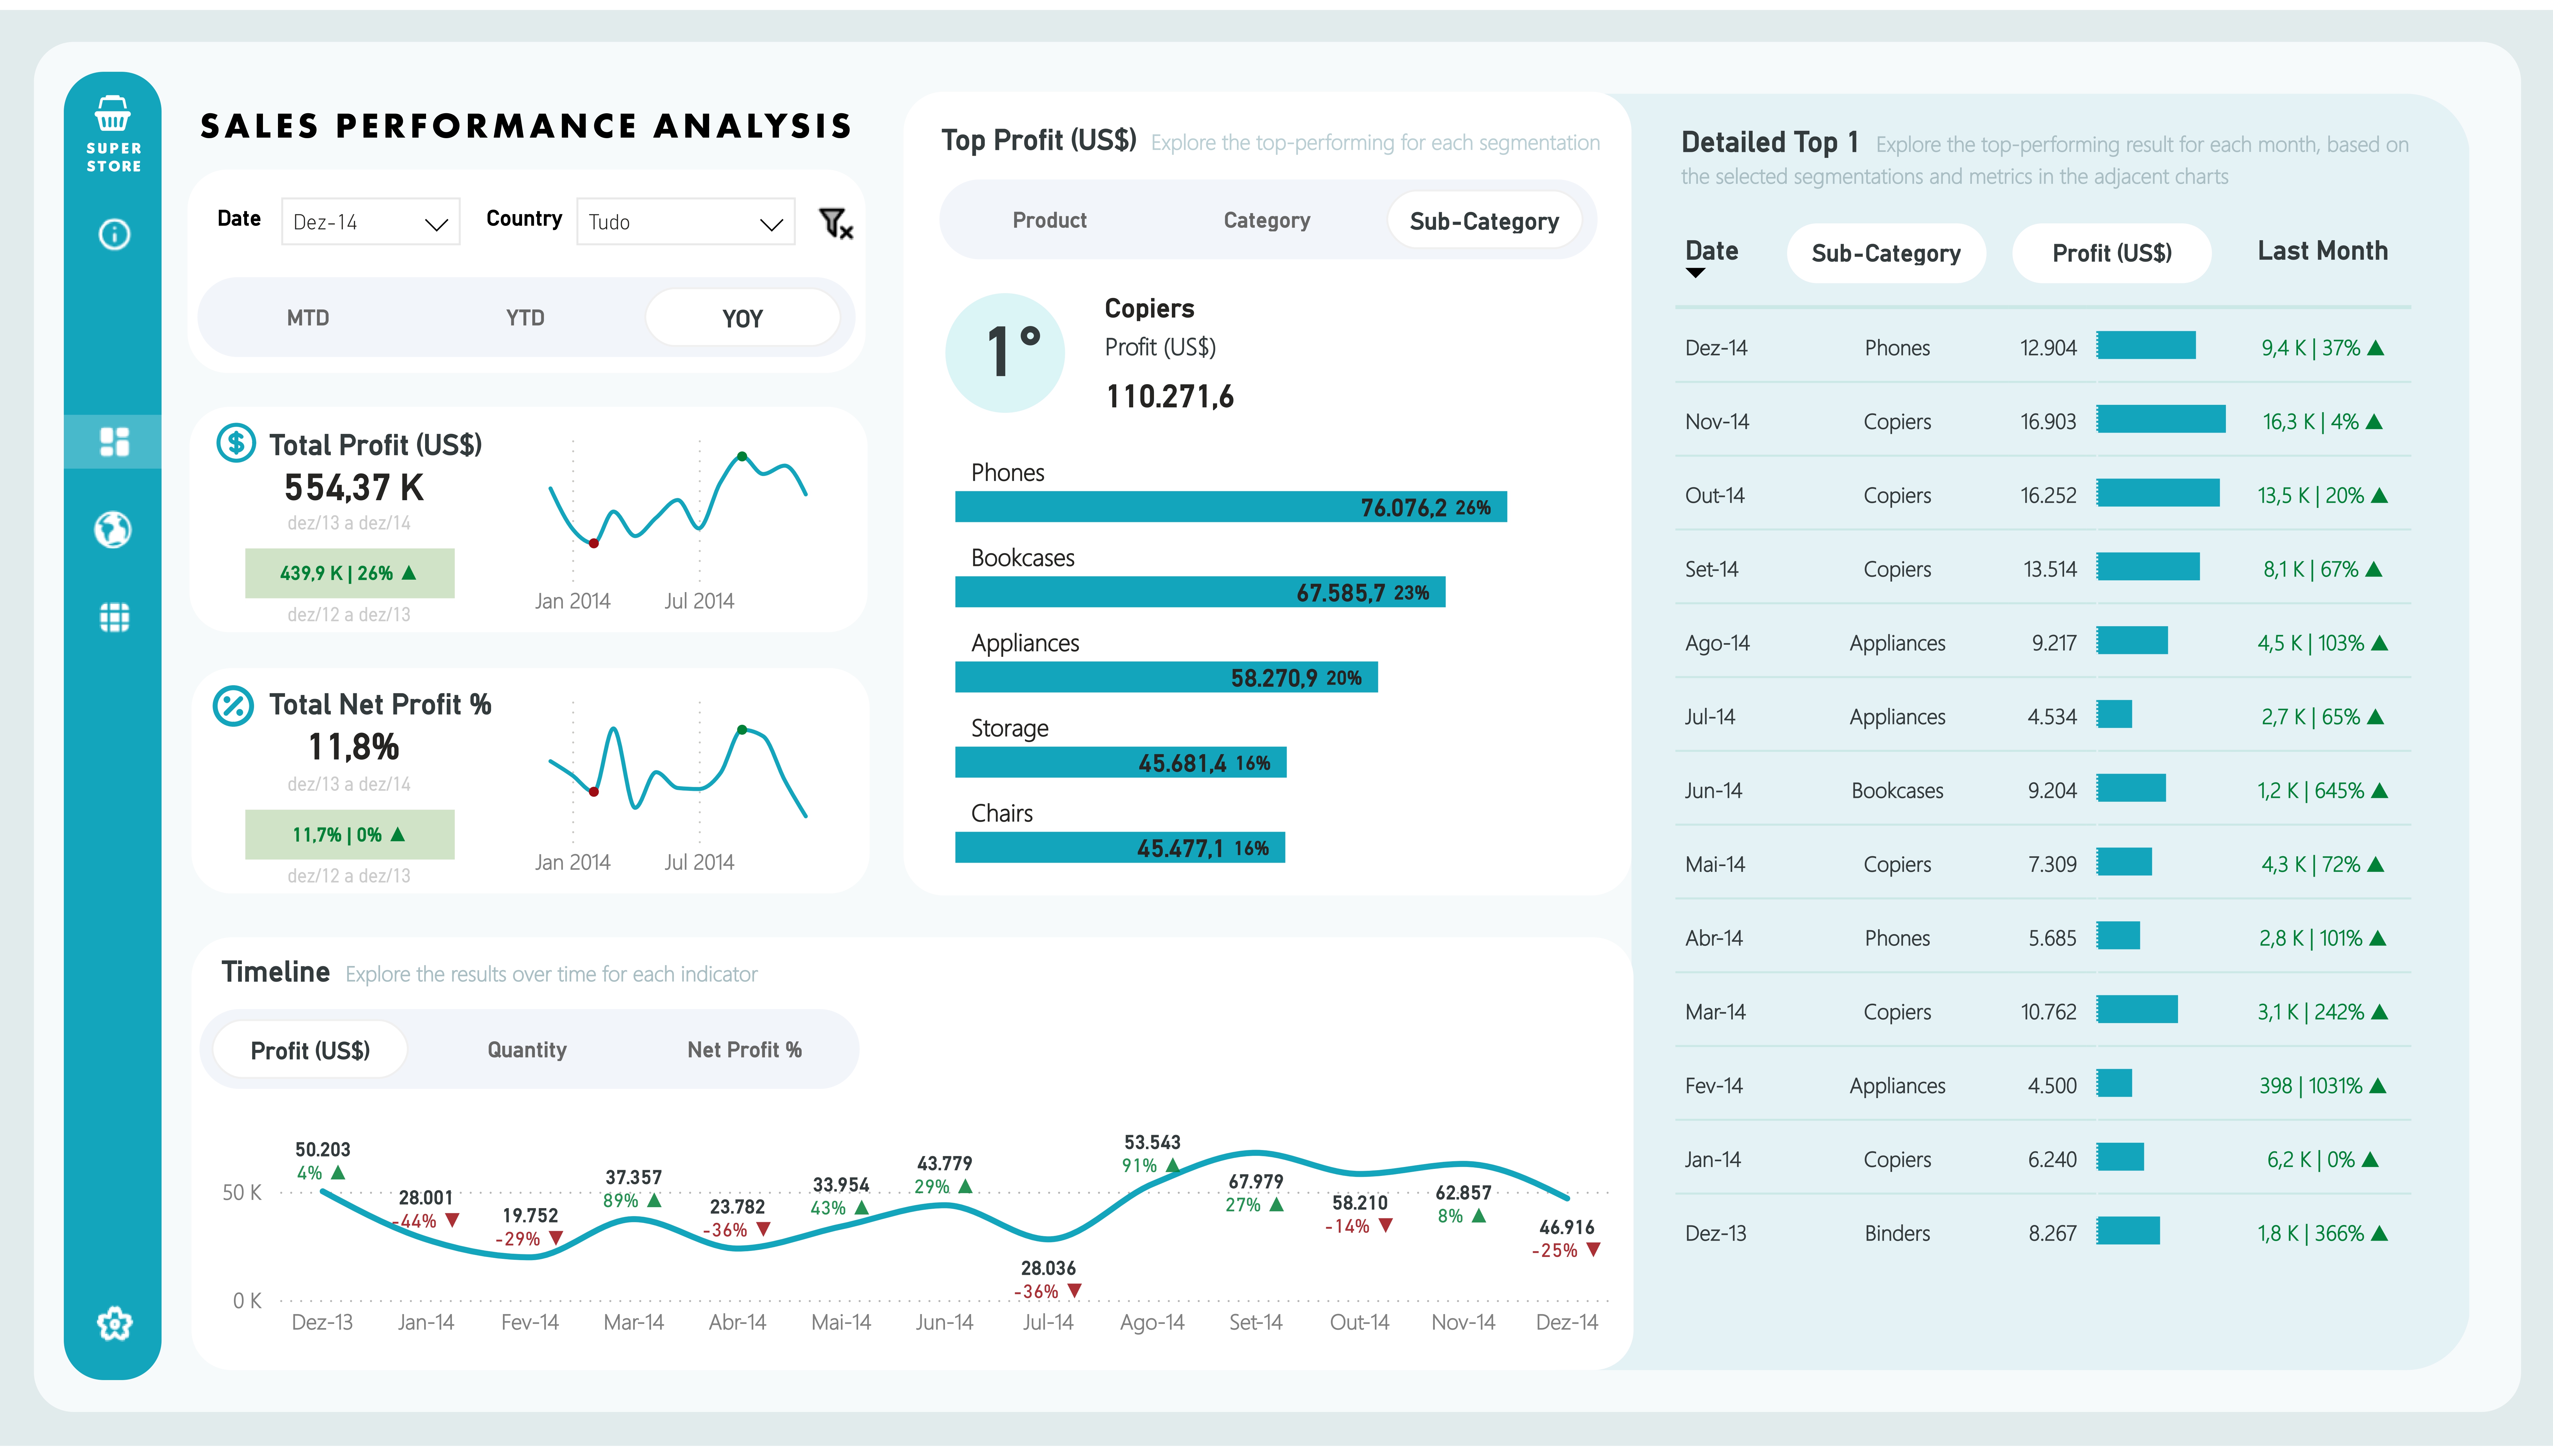
Super Store Power BI | EN-US
Power BI
-
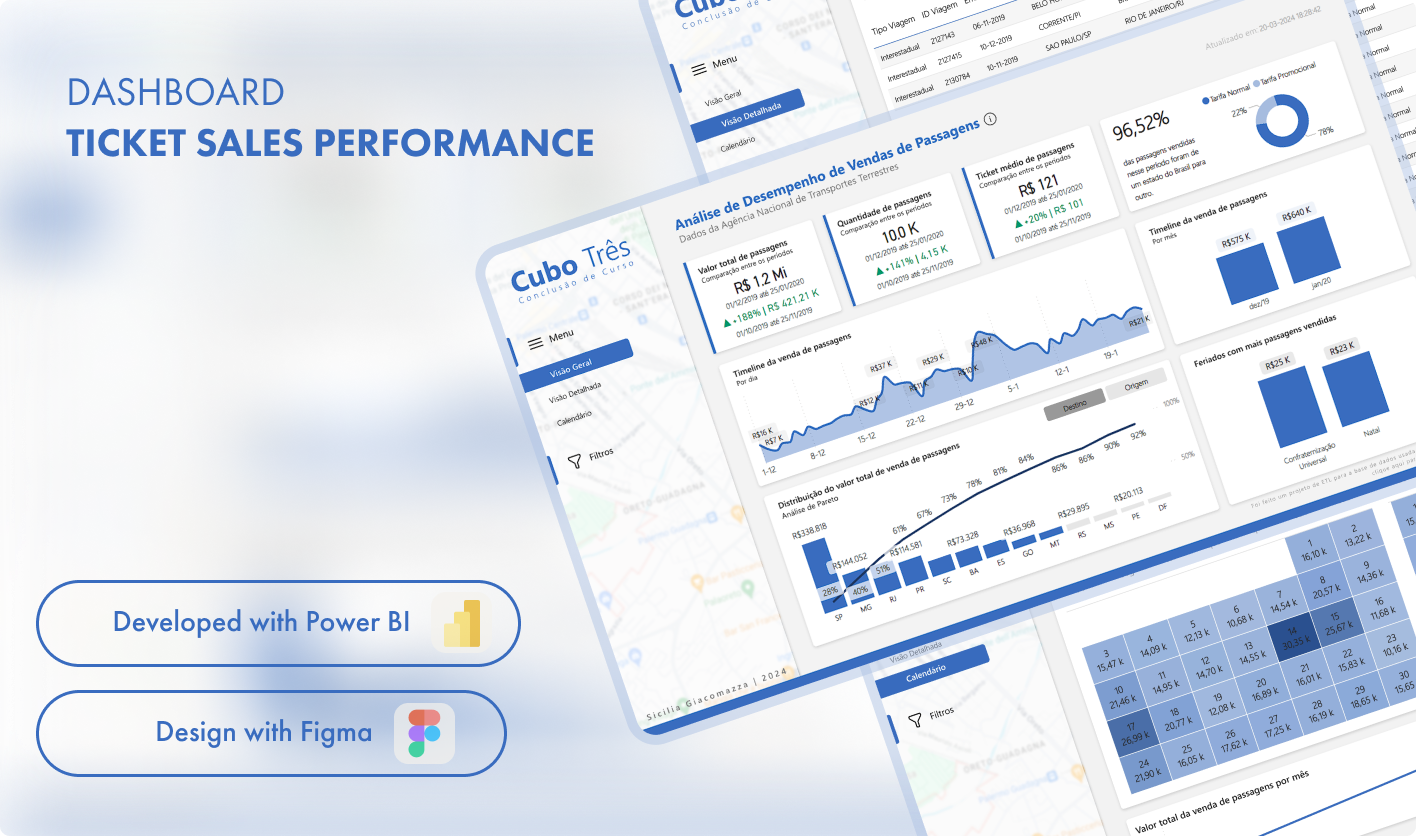
Ticket Sales Performance | PT-BR
Power BI
-
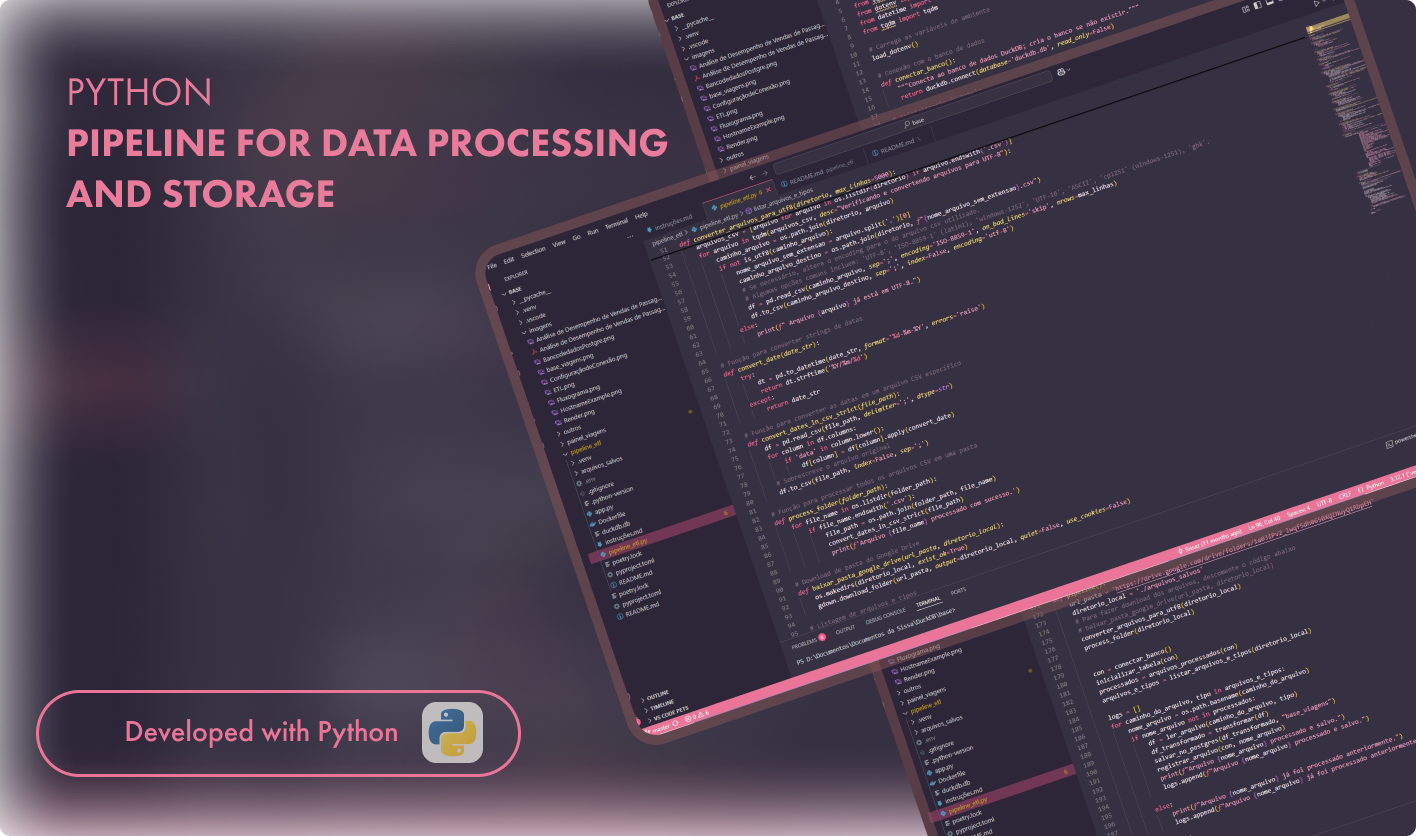
ETL for Ticket Sales Performance Dashboard | EN-US
Python
-
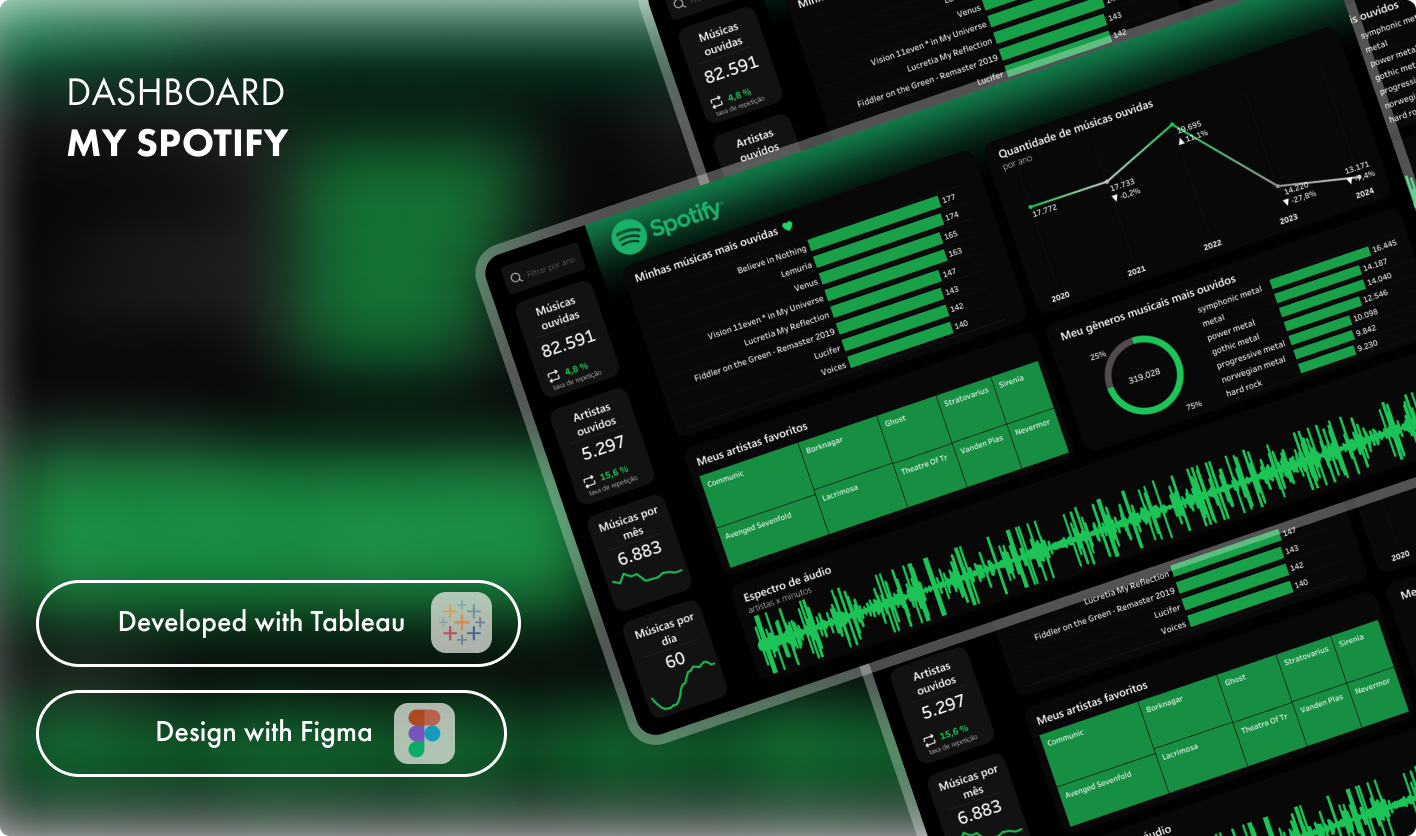
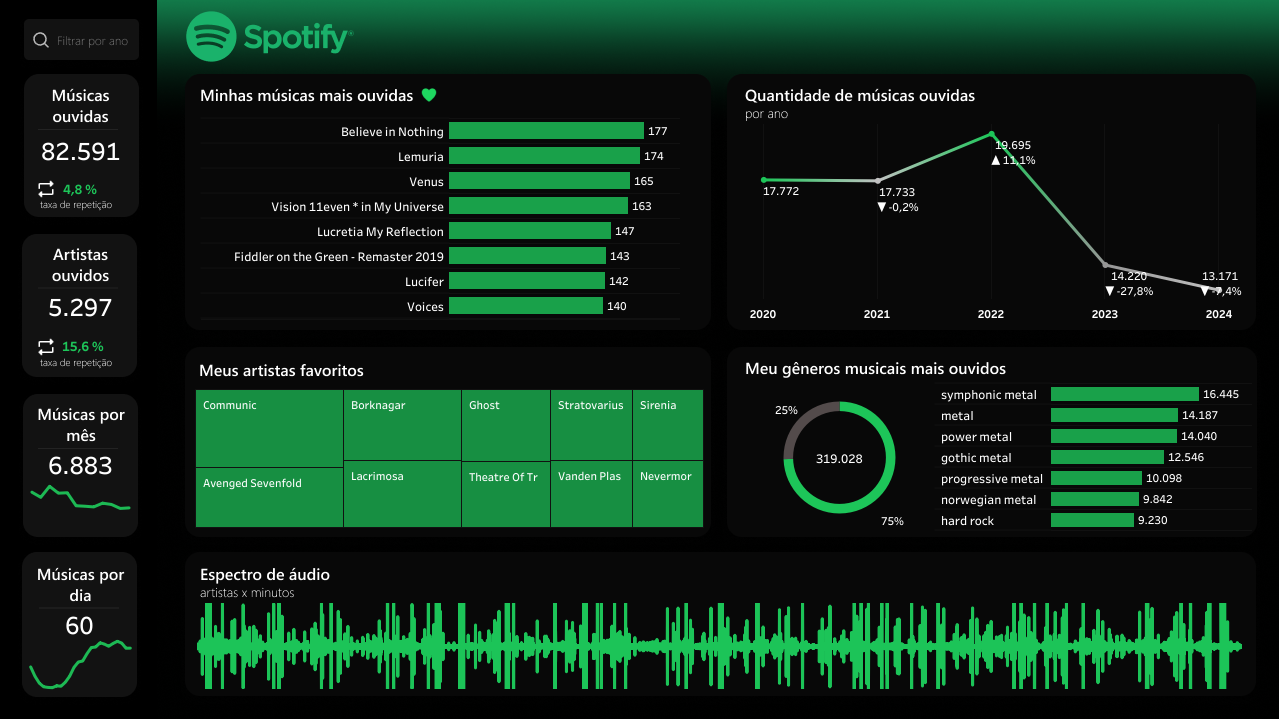
My Spotify Data Overview | PT-BR
Tableau
-
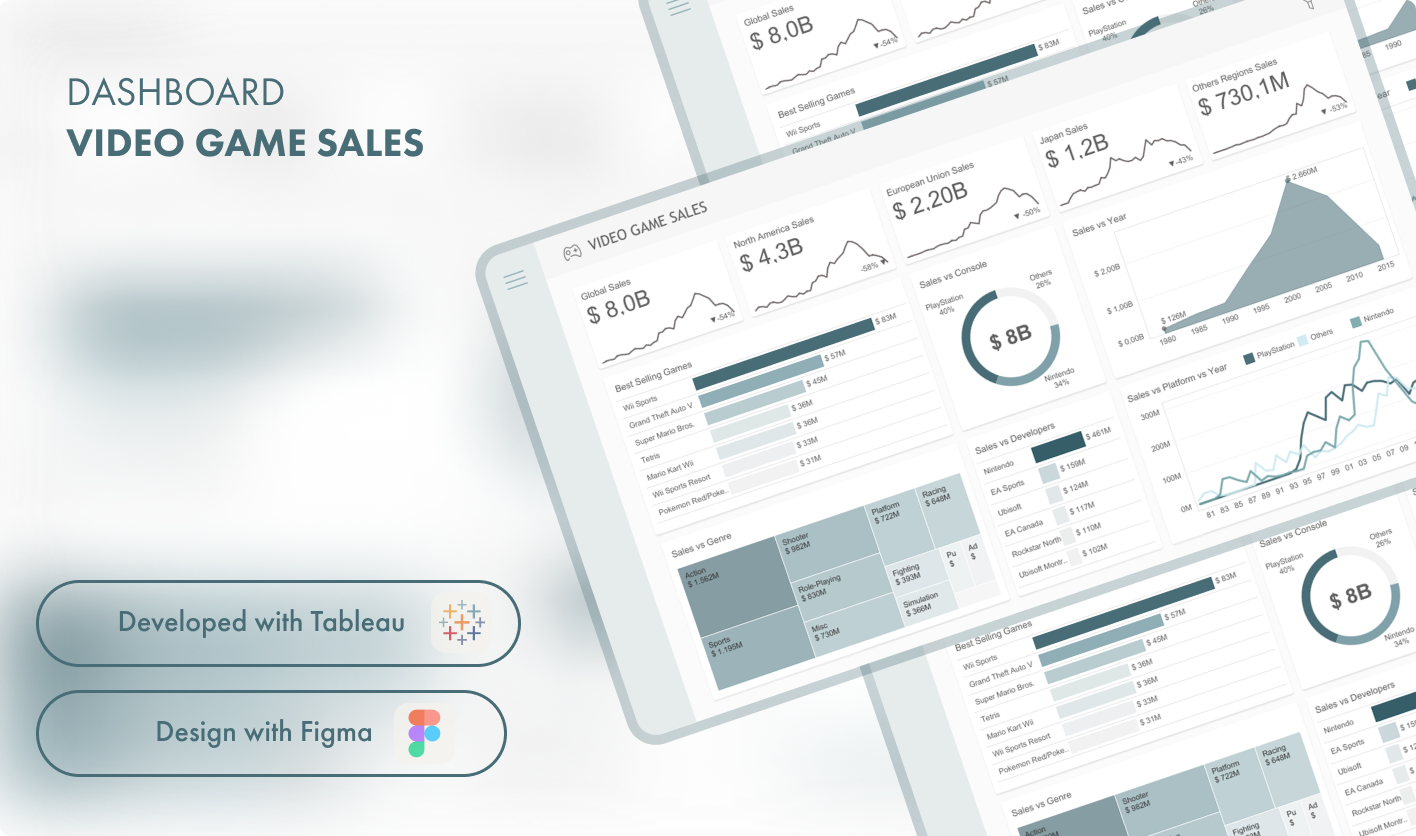
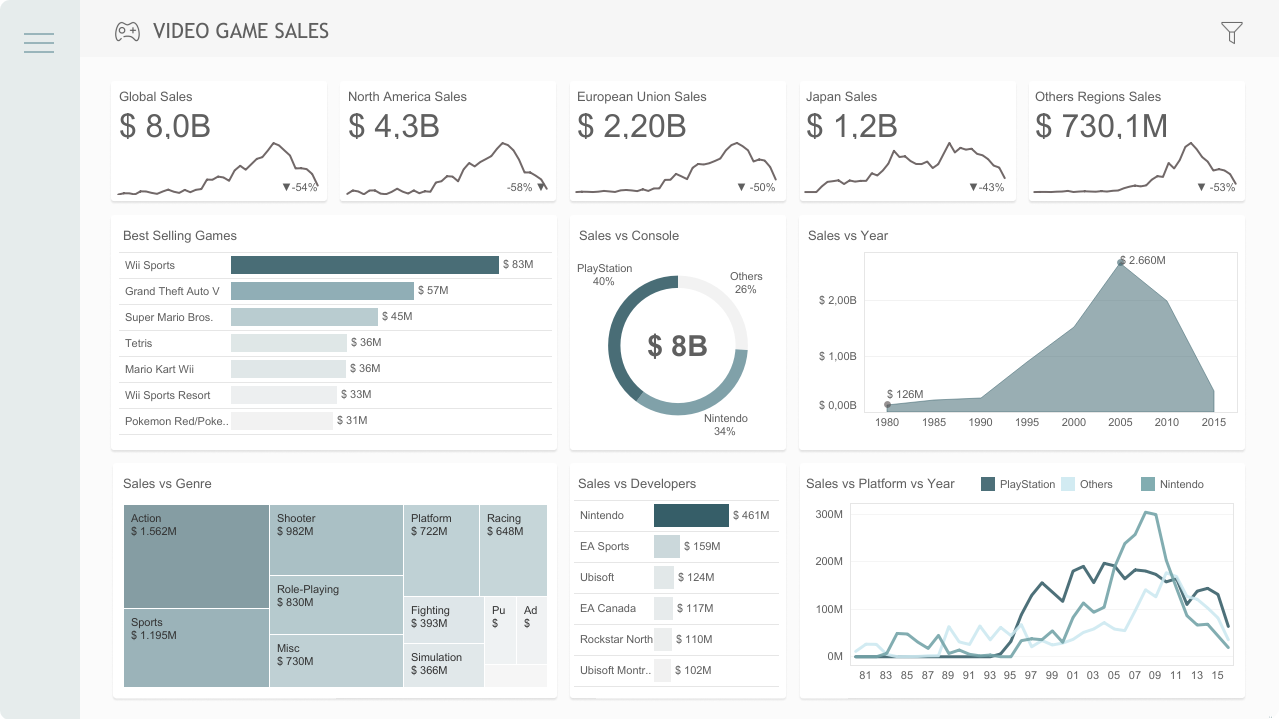
Video Game Sales Analysis| PT-BR, EN-US
Tableau
-

Spotify Listening History Retrieval and Storage from Spotify API | EN-US
Python